Table Extraction for Complex Government & Financial Filings
Nitai Dean
Updated Mar 27th, 2026 · 13 min read
Table of Contents
Table Extraction for Complex Government & Financial Filings
An analyst exports a table from a 10-K filing. The PDF looked clean: quarterly revenue by segment, neatly formatted across three pages. The extracted CSV is chaos. Row 47 contains data from columns 2, 5, and 8 concatenated together. The merged header "Revenue (in millions)" has become three separate cells. Page 2's numbers have no column headers at all. Four hours of manual cleanup later, the analyst starts the next table.
Financial filings and government documents are built on tables. SEC quarterly reports span multiple pages. Tax forms nest tables within tables. Regulatory submissions include hundreds of rows and dozens of columns. Traditional OCR handles these tables poorly. Merged cells break alignment. Multi-page tables lose header context. Nested structures flatten into incomprehensible sequences.
What You Need to Know
The problem: OCR sees pixels, not grids. It extracts text without understanding what belongs where. Merged cells, page breaks, and nested structures become chaos.
Why it's hard: Tables depend on visual boundaries to convey meaning. Traditional character-level extraction loses those relationships entirely.
What works: Structure-preserving extraction treats tables as structured data - cell relationships, header associations, and page continuity all preserved.
Bottom line: If your tables span pages or have merged cells, basic OCR produces garbage. You need visual understanding, not just text extraction.
For the broader context on enterprise document AI infrastructure, see the Enterprise Document AI Infrastructure hub article. For handling handwritten content alongside tables, see Handwriting & Checkboxes at Scale.
Why Nested Tables and Merged Cells Break Traditional OCR
OCR was designed to convert images to text. Tables require converting images to structured data. These are fundamentally different problems.
The Cell Boundary Problem
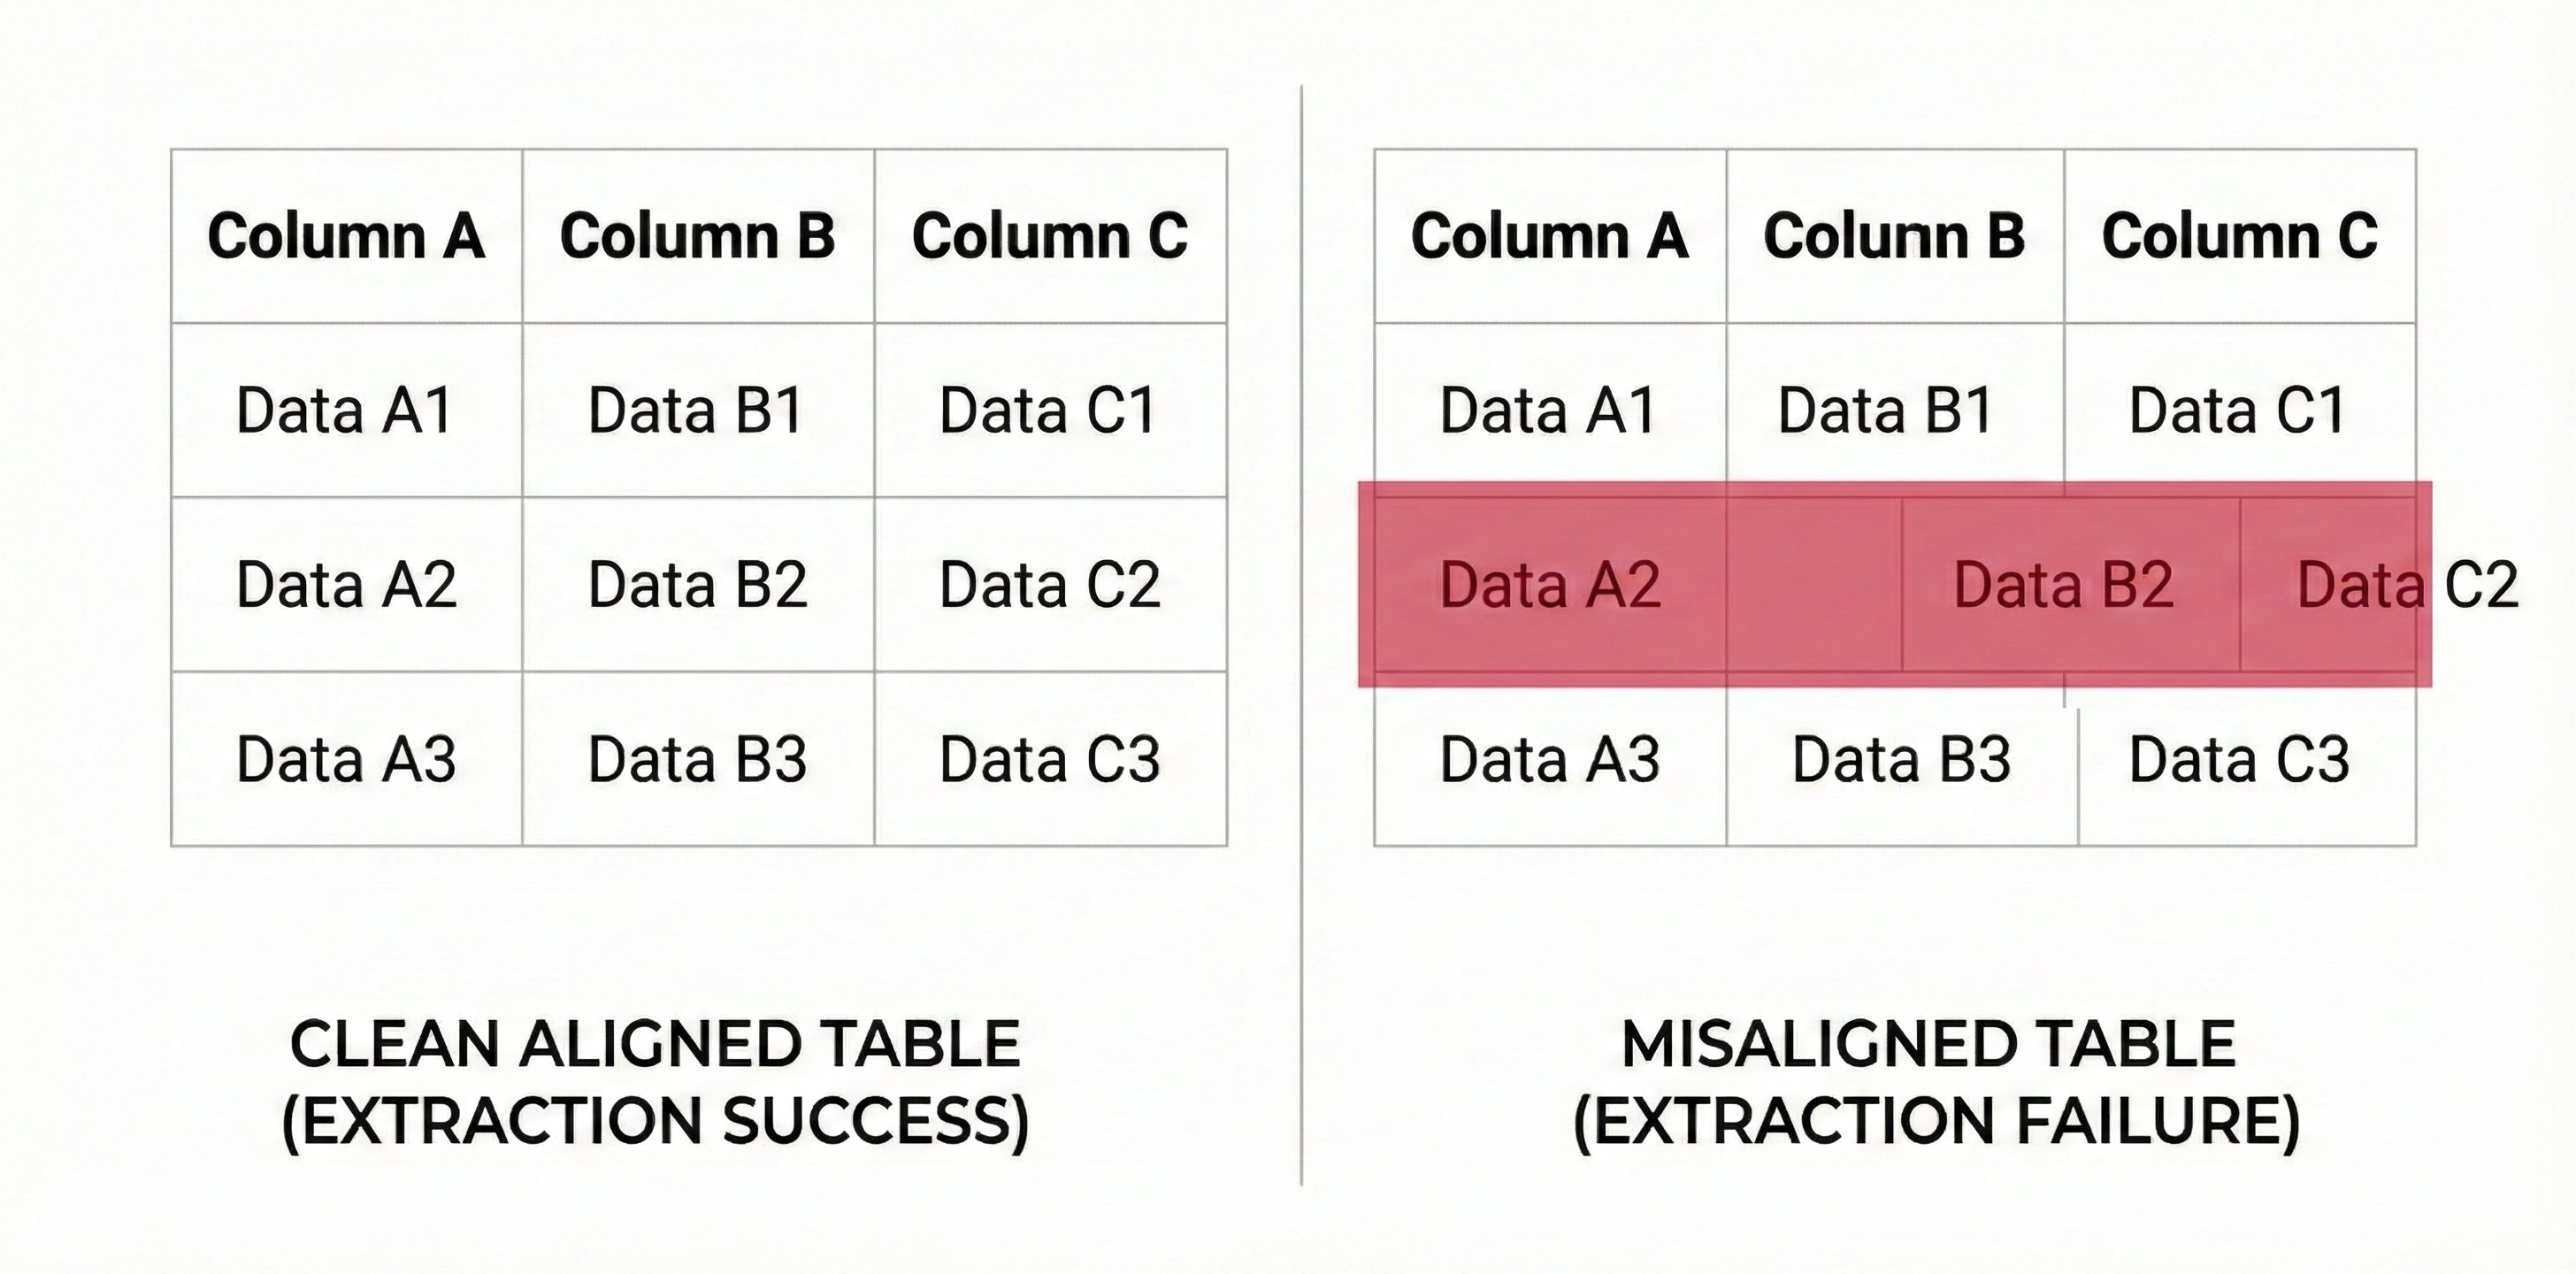 Table misalignment example showing extraction errors
Tables depend on visual boundaries to convey meaning. Which numbers belong to which columns? Which labels apply to which values? The visual grid answers these questions for human readers.
OCR sees pixels, not grids. It identifies text regions and extracts their content. Without understanding table structure, OCR produces:
Misaligned data:
Revenue    2024    2023    2022
          $45.2M   42.1M   38.7M
Expenses   31.4M   29.8M   27.2M
Becomes:
Revenue 2024 2023 2022 $45.2M 42.1M 38.7M Expenses 31.4M 29.8M 27.2M
The structure that makes this data meaningful is lost. Reconstructing which value belongs to which cell requires human interpretation.
Merged Cell Complications
Real financial tables include merged cells:
- Headers spanning multiple columns
- Row groups with shared labels
- Total rows spanning data columns
- Footnote markers bridging cells
Merged cells violate the simple grid assumption:
|                    Q1 2024                    |
| Revenue | Expenses | Net Income | Cash Flow  |
|   45.2  |   31.4   |    13.8    |    8.7     |
OCR without structure awareness cannot determine that "Q1 2024" spans all four columns. It may associate it with only "Revenue" or treat it as a separate row entirely.
Nested Table Structures
Complex documents nest tables within tables:
- Financial schedules with sub-schedules
- Form sections with embedded tables
- Appendices containing multiple table formats
- Hierarchical data presentations
Nested tables challenge even structure-aware systems:
Schedule A: Asset Summary
+------------------+----------+
| Category         | Value    |
+------------------+----------+
| Current Assets   |          |
|   +------------+-+------+   |
|   | Type       | Amount |   |
|   +------------+--------+   |
|   | Cash       | 12.5M  |   |
|   | Receivables| 8.3M   |   |
|   +------------+--------+   |
| Total Current    | 20.8M    |
+------------------+----------+
The outer table and inner table have different structures. Extraction must understand the nesting relationship to produce meaningful output.
Page Boundary Challenges
Financial tables frequently span pages. A balance sheet might start on page 12 and continue through page 14. Each page typically repeats headers but otherwise continues the data sequence.
Page-by-page processing creates problems:
- Header rows extracted as data on continuation pages
- Running totals appear multiple times
- Cross-page items may be split or duplicated
- Page numbers and footers intrude on table content
Correct extraction requires recognizing that pages 12, 13, and 14 contain one logical table, not three separate tables.
Maintaining Cell-Level Integrity Across Page Boundaries
Structure-preserving extraction addresses these challenges through visual understanding, explicit structure modeling, and intelligent page handling.
Visual Table Detection
Before extracting content, the system must identify table regions. Visual detection looks for:
Explicit boundaries:
- Printed grid lines
- Cell borders and shading
- Header row formatting
- Column separators
Implicit boundaries:
- Aligned text columns
- Consistent spacing patterns
- Repeating row structures
- Numeric alignment (decimal points, right alignment)
Tables without explicit borders are common in government forms. Implicit boundary detection handles forms where alignment creates visual structure without printed lines.
Cell-Level Extraction
Once table structure is identified, extraction operates at the cell level:
Cell identification:
- Each cell is bounded by coordinates
- Row and column indices are assigned
- Spanning cells receive appropriate indices
- Empty cells are explicitly noted
Content extraction:
- Cell content is extracted within boundaries
- Multi-line cell content is preserved
- Formatting within cells is captured
- Cell-level confidence scores are assigned
Relationship preservation:
- Header cells are linked to data cells
- Row groups are identified
- Column hierarchies are captured
- Merged cell spans are recorded
The output is not flat text but structured data with explicit cell relationships.
Header Detection and Association
Tables are meaningless without header context. Header detection identifies:
Row headers:
- First row or rows containing labels
- Repeated headers on continuation pages
- Hierarchical headers spanning multiple rows
- Units and formatting specifications
Column headers:
- First column or columns containing labels
- Category groupings
- Sub-labels for detailed breakdowns
- Identifier columns (dates, codes, names)
Once identified, headers are associated with data cells. This association is preserved in the extraction output, enabling downstream systems to understand what each value represents.
Multi-Page Table Handling
Tables spanning pages require special handling:
Continuation detection:
- Page ends mid-table (no closing borders)
- Next page begins with header repetition
- Content continuity suggests single table
- Page numbers/footers excluded from table content
Table merging:
- Continuation pages merged with originating page
- Duplicate headers removed
- Row indices continue across pages
- Single logical table in output
Cross-page items:
- Items split across page boundaries are identified
- Content from both pages is combined
- Original page references are preserved
- Split handling is noted in extraction metadata
The result is a single table structure regardless of physical page boundaries.
Stop cleaning up table extraction garbage.
Structure-Preserving Table Extraction
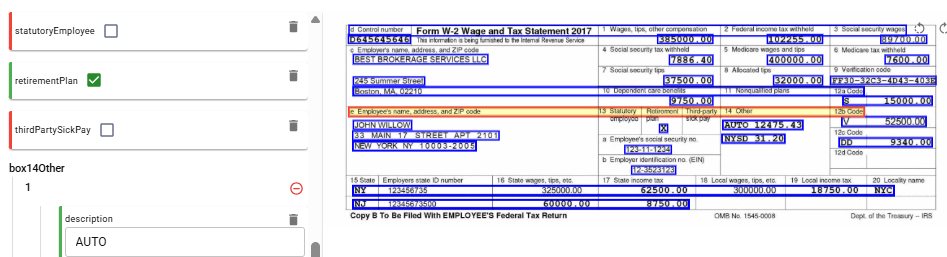 W-2 tax form showing table extraction with field-level bounding boxes and confidence scores
Complex tables require systematic handling. Structure-preserving extraction provides consistent results across document types.
Structure Classification
Tables are classified by structural complexity:
Simple tables:
- Single header row
- No merged cells
- No nesting
- Single page
- Standard OCR with structure awareness handles these reliably
Standard tables:
- Multiple header rows or columns
- Some merged cells (typically headers)
- No nesting
- May span pages
- Require explicit structure modeling
Complex tables:
- Nested table structures
- Extensive merged cells
- Multiple table formats in one document
- Cross-referenced data
- Require advanced visual understanding
Classification guides processing approach. Simple tables process quickly with standard methods. Complex tables receive more intensive analysis.
Extraction Output Format
Extracted tables are represented as structured JSON with full relationship information:
{ "table_id": "schedule_a_assets", "pages": [12, 13], "headers": { "columns": [ {"index": 0, "text": "Asset Category", "span": 1}, {"index": 1, "text": "2024", "span": 1}, {"index": 2, "text": "2023", "span": 1} ] }, "rows": [ { "index": 0, "type": "data", "cells": [ {"column": 0, "value": "Current Assets", "row_span": 1}, {"column": 1, "value": 45200000, "row_span": 1}, {"column": 2, "value": 42100000, "row_span": 1} ] } ], "provenance": { "bounding_boxes": [ {"page": 12, "x_min": 0.1, "y_min": 0.2, "x_max": 0.9, "y_max": 0.8}, {"page": 13, "x_min": 0.1, "y_min": 0.1, "x_max": 0.9, "y_max": 0.5} ] } }
This representation preserves:
- Cell relationships and structure
- Span information for merged cells
- Page provenance for audit
- Bounding boxes for visual verification
Validation Rules
Extracted tables are validated against structural expectations:
Completeness checks:
- All cells have content or explicit empty markers
- Header rows have expected column counts
- Data rows match header structure
- Multi-page tables have consistent columns
Consistency checks:
- Numeric columns contain valid numbers
- Date columns contain valid dates
- Totals match sum of components (when calculable)
- Cross-references resolve correctly
Integrity checks:
- Cell indices are unique and sequential
- Span declarations match actual structure
- Page references exist in document
- Bounding boxes are within page boundaries
Validation failures trigger review or reprocessing rather than producing corrupt data.
Integration Patterns
Extracted tables integrate with downstream systems through standard patterns:
Database loading:
- Column headers map to database columns
- Row data maps to records
- Relationships preserved through foreign keys
- Incremental loads supported
Spreadsheet generation:
- Structure maps directly to Excel/Sheets format
- Merged cells preserved in output
- Formulas generated for calculated fields
- Formatting approximates source
API responses:
- JSON structure returns directly
- Pagination for large tables
- Filtering by row/column criteria
- Aggregation endpoints available
Data warehouse integration:
- Dimensional modeling from table structure
- Fact tables from numeric data
- Dimension tables from categorical columns
- Historical loading with versioning
Complex Document Examples
SEC 10-K Filing:
- Consolidated financial statements (3-5 pages each)
- Notes with embedded tables
- Risk factor tables
- Executive compensation schedules
Extraction produces 15-30 distinct tables per filing with full structure preservation. Cross-references between tables are identified for relationship mapping.
Government Grant Application:
- Budget tables with categories and sub-categories
- Timeline tables with milestones
- Personnel tables with effort allocation
- Equipment tables with specifications
Nested structures are preserved. Budget roll-ups validate against detailed line items. Timeline dependencies are extractable.
Bank Regulatory Filing:
- Capital adequacy tables
- Risk-weighted asset breakdowns
- Liquidity coverage calculations
- Stress test result tables
Regulatory filings have strict format requirements. Extracted tables match expected structures. Validation confirms compliance with format specifications.
Implementation Considerations
Deploying table extraction at scale requires attention to performance, accuracy monitoring, and edge case handling.
Performance Optimization
Complex table extraction is computationally intensive:
Caching strategies:
- Table detection results cached
- Structure analysis reused across similar documents
- Parsed document representations stored
- Incremental reprocessing for corrections
Parallelization:
- Multi-page tables processed in parallel phases
- Independent tables in same document parallelized
- Batch processing across documents
- GPU acceleration for visual analysis
Resource allocation:
- Simple tables route to lightweight processing
- Complex tables receive intensive resources
- Adaptive allocation based on document characteristics
- Queue management prevents bottlenecks
Accuracy Monitoring
Production systems require ongoing accuracy tracking:
Sampling-based validation:
- Random sample of extractions manually verified
- Accuracy metrics tracked over time
- Drift detection for degrading performance
- Alerts when accuracy drops below thresholds
Automated validation:
- Mathematical relationships verified
- Cross-table consistency checked
- Historical comparisons for sequential filings
- Format compliance confirmed
Feedback integration:
- Human corrections captured
- Error patterns analyzed
- Model improvements deployed
- Threshold adjustments based on performance
Edge Case Handling
Real documents include edge cases that require graceful handling:
Malformed tables:
- Missing borders or inconsistent structure
- Fall back to visual interpretation
- Flag uncertainty for human review
- Partial extraction better than failure
Unusual formats:
- Rotated tables or pages
- Tables embedded in flowing text
- Tables as images rather than native PDF
- Scanned documents with quality issues
Ambiguous structures:
- Multiple valid interpretations possible
- Confidence scores reflect ambiguity
- Alternative interpretations available
- Human resolution for critical documents
Key Takeaways
- OCR sees text, not structure - without understanding the visual grid, cell relationships are lost
- Merged cells break the grid assumption - headers spanning columns, total rows, nested structures all violate simple row/column logic
- Multi-page tables need intelligent handling - continuation detection, header deduplication, cross-page item merging
- Output must preserve relationships - JSON with cell indices, header associations, span info, and bounding boxes for audit
- Validation catches extraction failures - completeness checks, consistency checks, totals matching components
Extract tables that actually work.
OCR sees pixels, not grids. It identifies text regions and extracts content without understanding table structure. This produces misaligned data where values are extracted but their row/column relationships are lost. Merged cells, nested structures, and page boundaries compound the problem. Each violates the simple grid assumption that basic OCR depends on.
Continuation detection identifies when pages end mid-table and the next page begins with header repetition. Table merging combines continuation pages with originating pages, removes duplicate headers, and continues row indices across pages. Cross-page items are identified and combined. The result is a single logical table regardless of physical page boundaries.
Extracted tables are represented as structured JSON with full relationship information: cell values with row/column indices, span information for merged cells, header associations linking labels to data columns, page provenance with bounding-box coordinates, and confidence scores. This structure enables direct database loading, spreadsheet generation, or API integration.
Recommended Articles
Related Documents