DOCUPIPE
Solutions
Resources
Pricing
Table Extraction from Documents: The Complete Guide (2026)
Nitai Dean
Updated Jan 26th, 2026 · 8 min read
Table of Contents
Table Extraction from Documents: The Complete Guide
Tables contain the most valuable data in your documents, and they're the hardest to extract correctly.
Table extraction is the process of identifying tables within documents and converting their contents into structured, row-column data that preserves the relationships between cells, headers, and values. Unlike simple text extraction, table extraction systems must understand the spatial relationships that give tabular data its meaning.
Tables are everywhere: from invoice line items and bank transactions to medical charges and lease rent rolls. In important documents, tables often contain the data that actually matters to a business. The problem is that tables are also where most extraction tools fail. For a broader view of how modern document AI works, see our complete guide to document extraction.
What You Need to Know
Why tables are hard: Tables rely on spatial relationships. "15.00" means nothing without knowing it's in the "unit price" column for the "widget" row. Most extraction tools completely lose these relationships.
Common failures: Merged cells get misaligned. Multi-row headers confuse column mapping. Tables spanning pages lose their structure. Nested tables break entirely.
What works: AI models trained specifically for table detection and structure recognition. These models identify table boundaries, parse cell relationships, and maintain structure across pages.
The confidence score difference: Quality table extraction will give you confidence scores for each cell, not just the table overall. This is important because you need to know exactly which cells to trust and which need review.
Table of Contents
- Why Table Extraction Is So Challenging
- How Table Extraction Works
- Common Table Extraction Failures
- Table Extraction Accuracy: What to Expect
- What to Look for in Table Extraction Solutions
- Table Extraction Use Cases
- FAQ
- Key Takeaways
Why Table Extraction Is So Challenging
Tables look simple to humans. We glance at a table and immediately understand the structure. Software doesn't inherently have our intuition.
The Spatial Relationship Problem
Text extraction reads characters in sequence. Tables require understanding two-dimensional relationships. The value "500" in row 3, column 4 has meaning because of its position relative to headers and row labels. Extract just the text, and you'll be left with "500" and no context.
No Universal Table Format
There's no standard way to format a table in a PDF. Some tables have visible gridlines. Some use alternating colors. Some have no visual separators at all, just aligned text. The extraction system needs to recognize all of these as tables to efficiently extract the data from them.
Merged Cells and Complex Headers
Real-world tables aren't simple grids:
- Headers spanning multiple columns ("Q1 2026" over "Jan," "Feb," "Mar")
- Row labels spanning multiple rows (a category grouping several line items)
- Cells containing multiple lines of wrapped text
- Nested tables within cells
Each of these breaks classic extraction approaches.
Tables Spanning Multiple Pages
Long tables continue across page breaks. The header appears only on page one, but the data continues for pages. The extraction system must:
- Recognize that the table continues
- Maintain header context across pages
- Not duplicate data that appears in repeated headers
How Table Extraction Works
Modern table extraction combines multiple AI capabilities.
Step 1: Table Detection
Before extracting data, the system identifies where tables exist in the document. This is a computer vision challenge: recognizing table-like structures (whether it be grids or text placement) in document images.
Detection must distinguish actual tables from:
- Lists that look tabular
- Multi-column text layouts
- Form fields arranged in grids
- Decorative elements with lines
Step 2: Structure Recognition
Once a table is detected, the system parses its structure. It answers questions such as:
- Where do rows and columns begin and end?
- Which cells are headers vs. data?
- Which cells are merged, and how?
- What's the reading order within cells?
This is where most tools fail. They detect that a table exists but can't accurately understand its structure to process it efficiently.
Step 3: Cell Extraction
With structure understood, the system extracts content from each cell. This includes:
- The text content
- The cell's position (row, column)
- Whether it's a header or data cell
- Confidence score for the extraction
Confidence scores at the cell level matter. A table might have 50 cells extracted correctly and 2 cells that are uncertain. Cell-level confidence scores allow you to review just those 2 cells instead of reading through the entire table.
Step 4: Output Formatting
Extracted tables output in formats that preserve structure:
- JSON with nested row/column data
- CSV for spreadsheet import
- HTML tables for display
- Markdown for documentation
The output maintains the relationships that give tabular data its meaning.
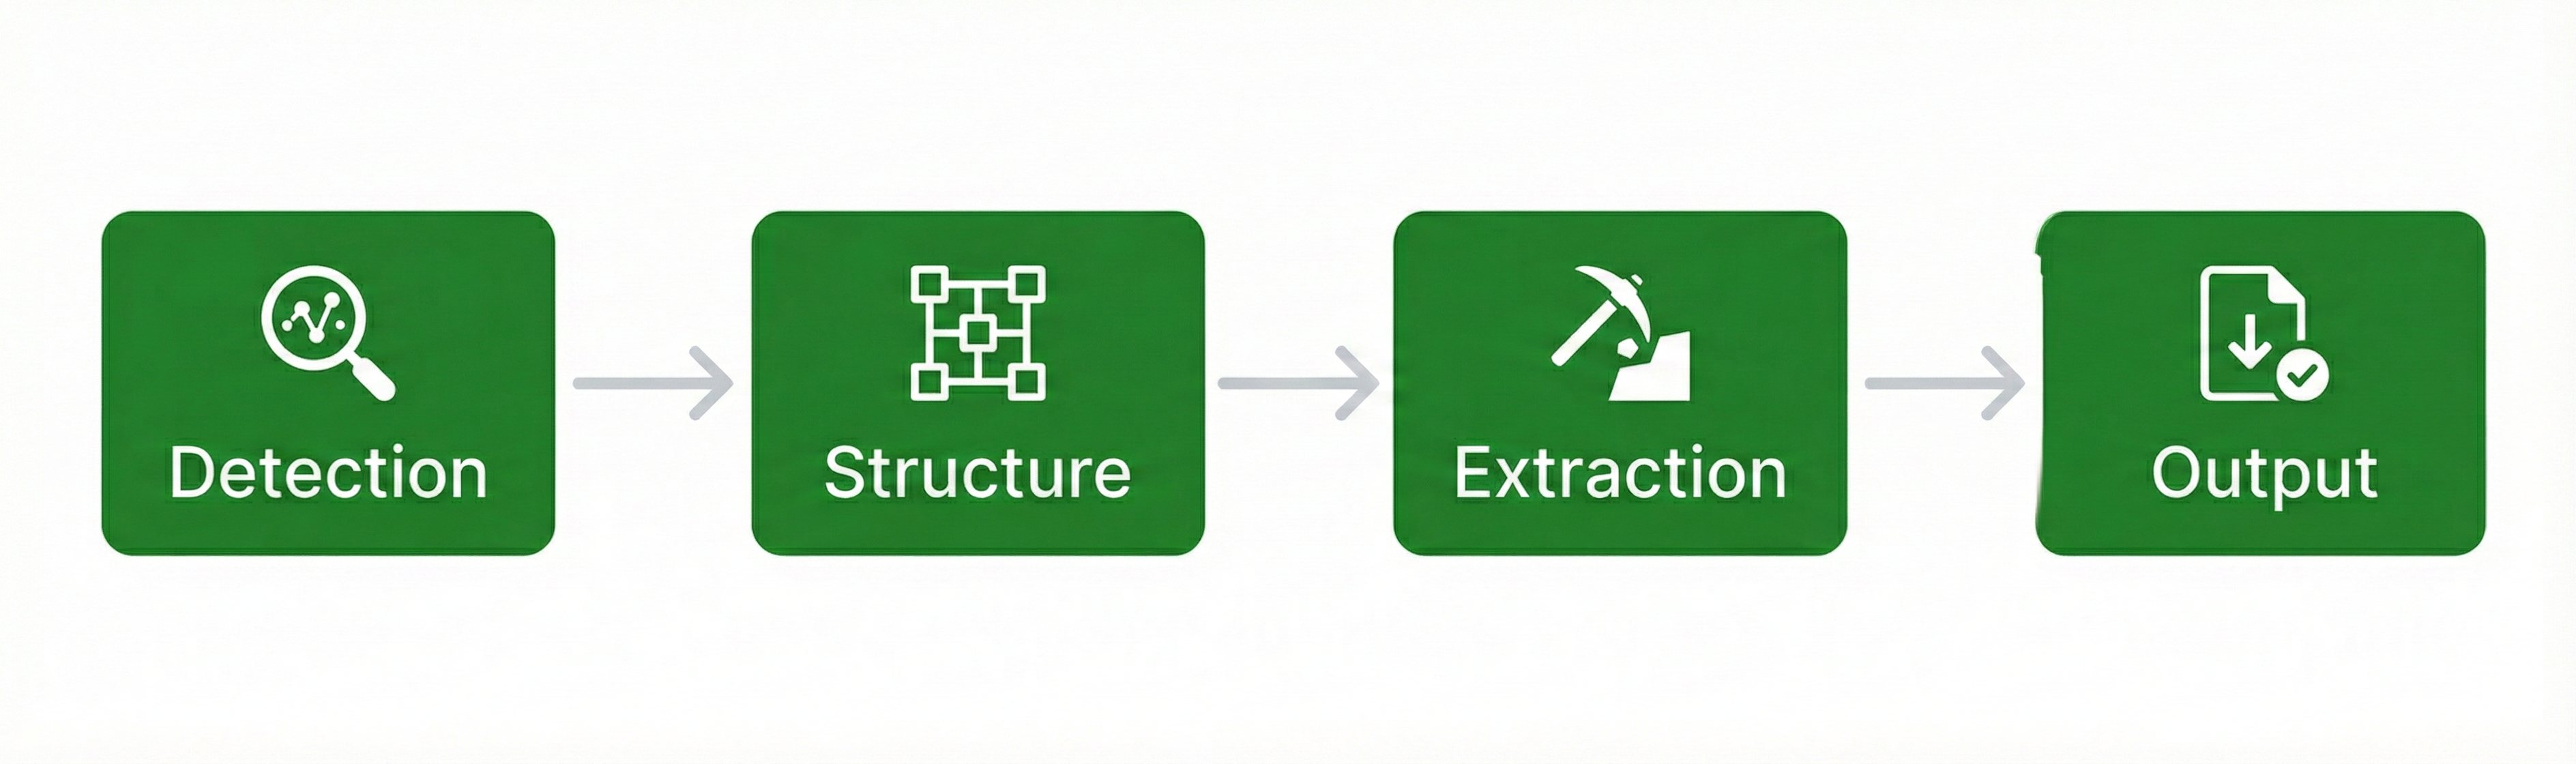 Table extraction process: Detection, Structure Recognition, Cell Extraction, Output
Common Table Extraction Failures
Understanding failure modes helps you evaluate solutions.
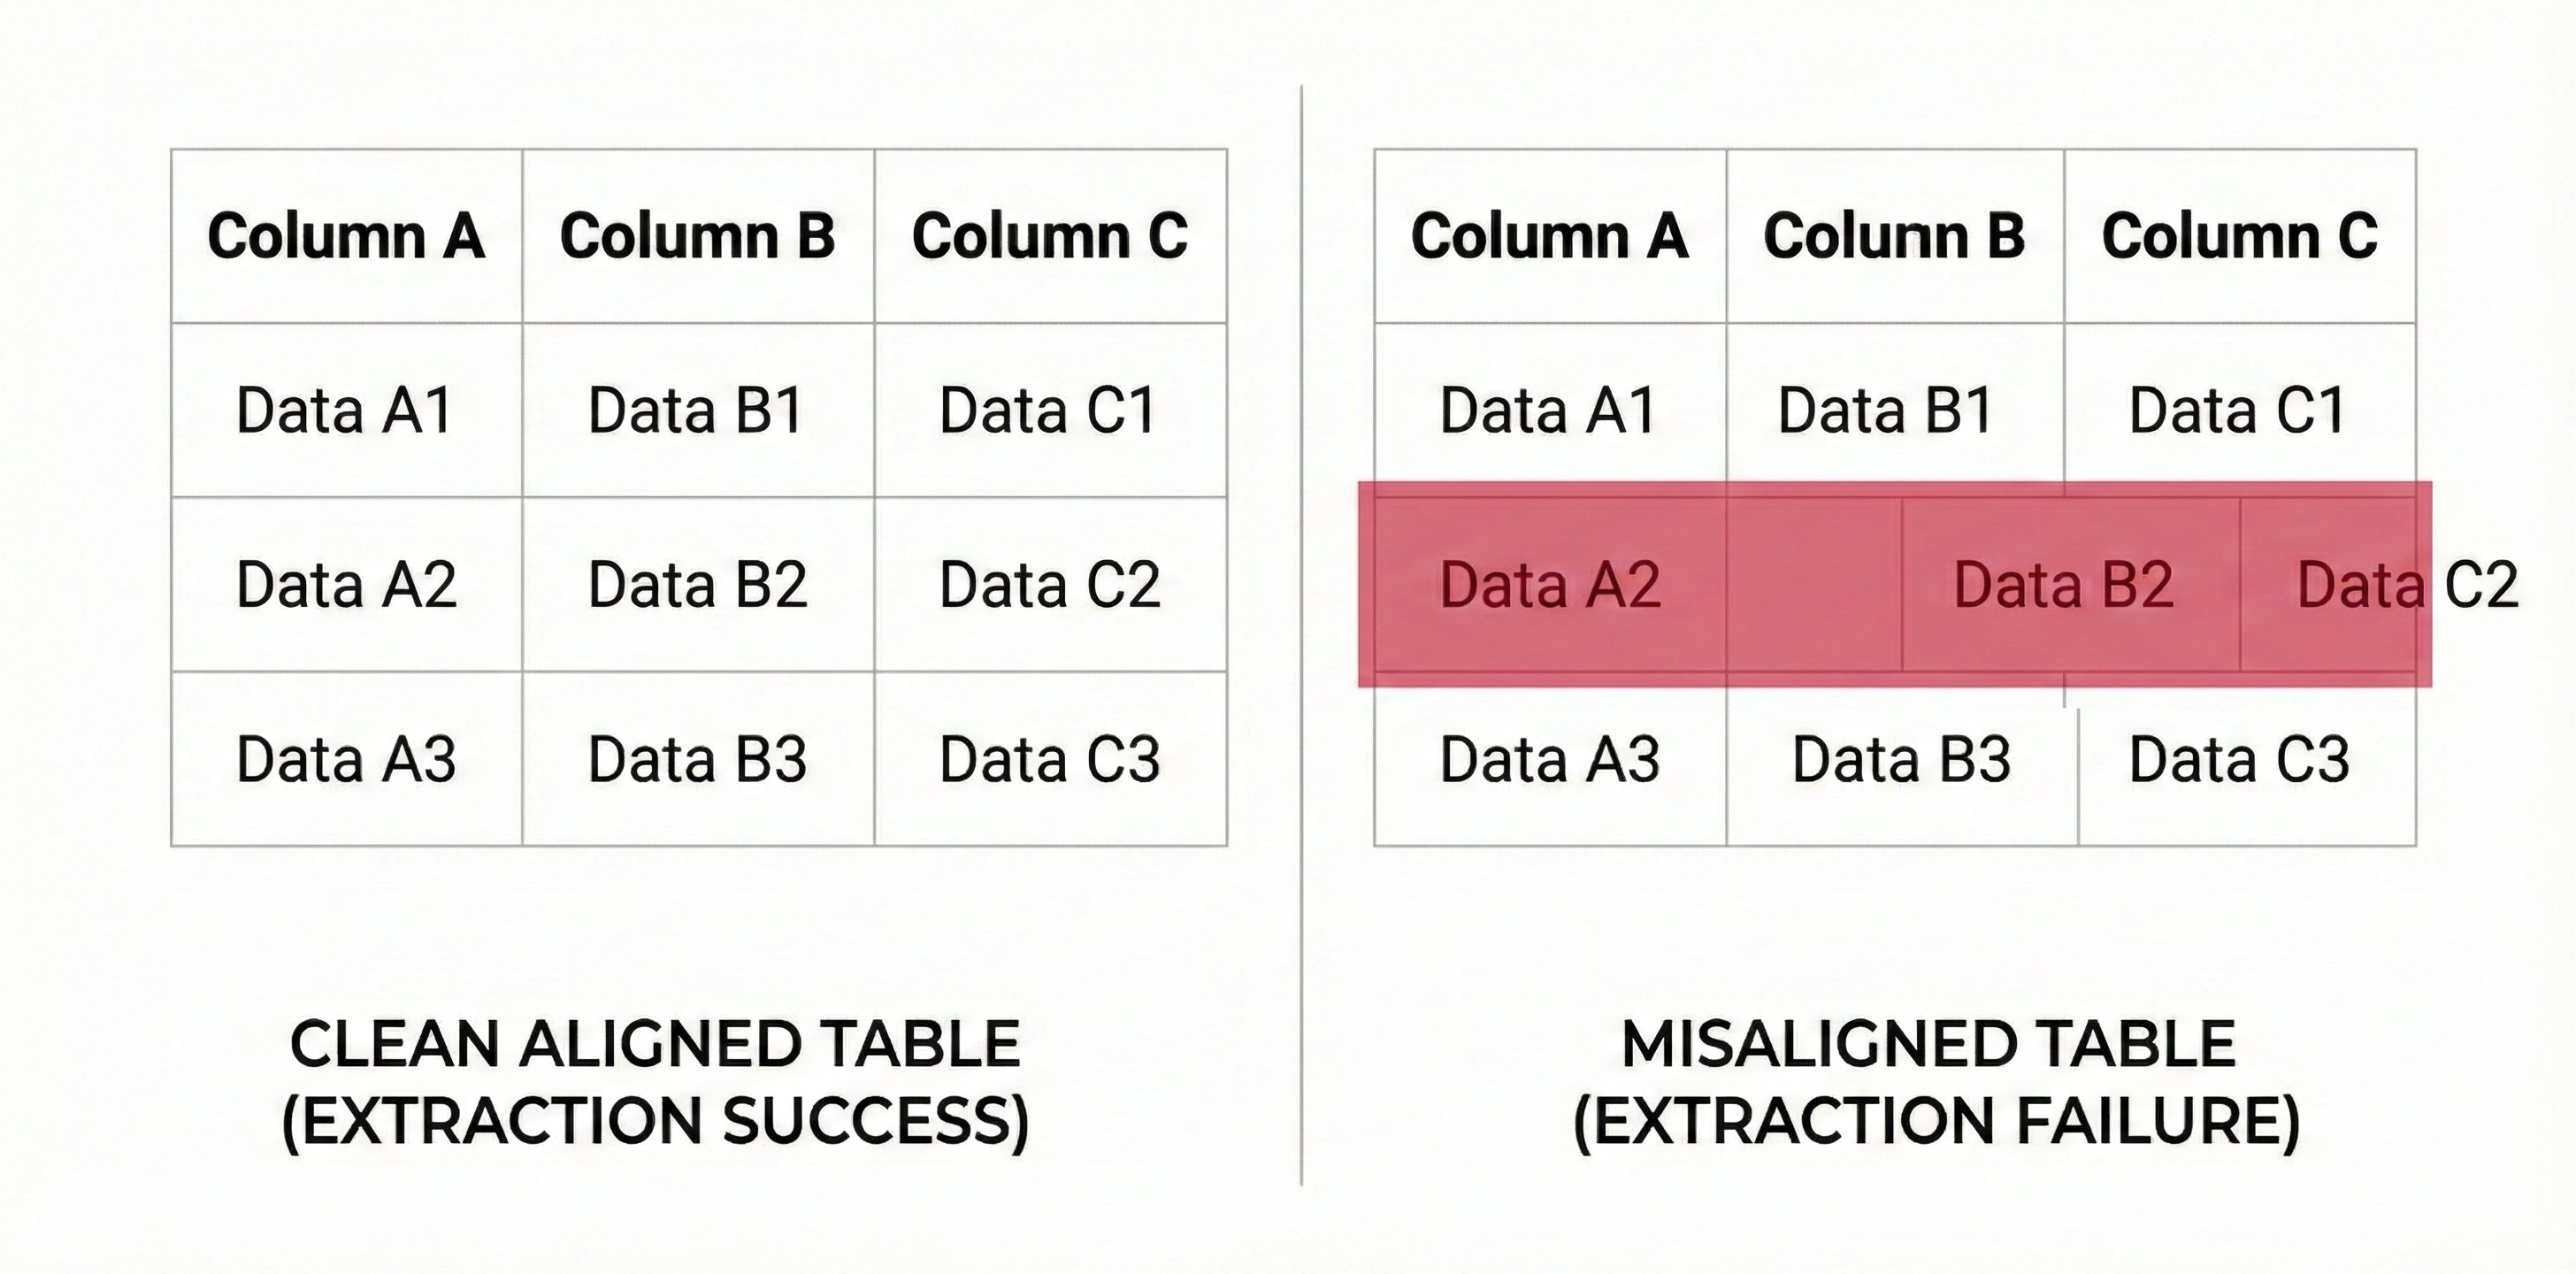 Example of column misalignment in table extraction
Misaligned Columns
The most common failure. Text from one column gets assigned to an adjacent column, corrupting the entire row. This happens when column boundaries aren't detected correctly.
Example: In an invoice line item table, the quantity "10" gets placed in the unit price column, and suddenly you're paying 10x the actual price. This is fine if it's the difference between $5 and $50, but is catastrophic if it's the difference between $500,000 and $5,000,000.
Lost Merged Cells
Headers spanning multiple columns get extracted as if they're in a single column. Sub-categories get disconnected from their parent categories.
Example: "2025 Revenue" spans Q1, Q2, Q3, Q4 columns. Bad extraction places it only in Q1, leaving Q2-Q4 without a category header.
Broken Multi-Page Tables
Page breaks mid-table cause problems:
- Header rows get re-extracted as data rows
- Table continuation isn't recognized
- Partial rows at page boundaries get corrupted
Example: A 200-row transaction table gets extracted as two separate tables with missing rows at the break.
Nested Table Disasters
Tables within tables (common in financial documents) either get flattened incorrectly or ignored entirely.
Example: A summary table contains a detailed breakdown table in one cell. Flat extraction merges them into nonsense instead of identifying and extracting all the important data.
Table Extraction Accuracy: What to Expect
Accuracy varies significantly by table complexity.
| Table Type | Typical Accuracy | Challenge Level |
|---|---|---|
| Simple grid with lines | 95-99% | Easy |
| No visible borders | 85-95% | Medium |
| Merged headers | 80-95% | Medium |
| Multi-page tables | 75-90% | Hard |
| Nested tables | 70-85% | Very Hard |
| Handwritten tables | 60-80% | Very Hard |
What to Look for in Table Extraction Solutions
Cell-Level Confidence Scores
This is the key differentiator. Solutions that give you only document-level or table-level confidence force you to review entire tables. Cell-level confidence lets you review only uncertain cells.
Example: If you got 93% overall accuracy, cell-level confidence scores let you identify exactly which cells are uncertain. With confidence scores you'd only have to review 7% of cells instead of 100% of the table.
It's important to ask specifically: "Do you provide confidence scores for each cell?" If the answer is no, keep looking.
Bounding Box Visualization
Can you click on an extracted value and see exactly where it came from in the original document? This auditability is integral for debugging and building trust in the extraction.
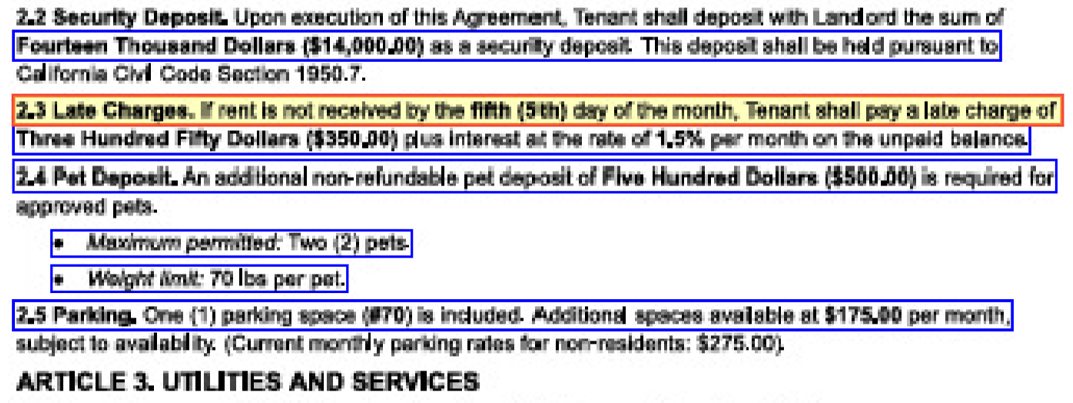 Table with extracted cells highlighted
Merged Cell Handling
Ask specifically how the solution handles merged cells. Request examples with complex headers spanning multiple columns.
Multi-Page Table Support
If your documents have tables spanning pages, this is critical. Test with actual multi-page tables, not just easy single-page examples.
Output Format Flexibility
Different downstream systems need different formats. Look for JSON, CSV, HTML, and API output options.
Handling of Borderless Tables
Many documents use spacing rather than lines to define tables. Solutions trained only on gridlined tables will fail you on borderless layouts.
Table Extraction Use Cases
Financial Statements
Balance sheets, income statements, and cash flow statements are incredibly complex tables. Extracting them accurately enables automated financial analysis and comparison.
Invoice Line Items
Every invoice has a line item table. Accurate extraction enables automated three-way matching against purchase orders and receiving documents. See our guide to invoice data extraction for more on automating AP.
Bank Statements
Transaction tables in bank statements contain the data needed for reconciliation, underwriting, and audit. See our guide to bank statement extraction to learn more.
Medical Bills
Detailed charges, procedure codes, and itemized services appear in tables. Extracting them enables cost analysis and billing verification.
Contracts and Schedules
Payment schedules, pricing tables, and term matrices in contracts contain critical obligation data. Extraction enables contract analytics and easy compliance monitoring.
FAQ
Table extraction identifies tables in documents and converts them to structured data that preserves row-column relationships. It goes beyond text extraction by maintaining the spatial relationships that give tabular data meaning.
Tables rely on two-dimensional spatial relationships. Most extraction tools process text sequentially and lose the structure. Merged cells, multi-page tables, and borderless layouts add complexity that generic tools can't handle.
Simple tables with clear gridlines achieve 95-99% accuracy. Complex tables with merged cells or spanning pages may achieve a slightly lower rate. Cell-level confidence scores help you identify which specific cells need further review.
Yes, if the solution is trained for it. Many documents use spacing rather than lines to define tables. Look for solutions that explicitly support borderless table detection.
Good solutions recognize table continuation across pages, maintain header context, and avoid duplicating repeated headers. This is a common failure point, so test specifically with your multi-page tables.
Common formats include JSON (nested row/column structure), CSV (spreadsheet-compatible), HTML (for display), and direct API delivery to downstream systems.
Cell-level confidence scores let you review only uncertain cells instead of entire tables. A 50-cell table with 2 uncertain cells requires reviewing only 2 cells, not all 50.
Some solutions can, but this is advanced functionality. Nested tables (tables within cells) are common in financial documents. Ask specifically about nested table support and test with examples to make sure.
Key Takeaways
- Table extraction preserves spatial relationships that give tabular data meaning. Simple text extraction loses this structure.
- Common failures include misaligned columns, lost merged cells, and broken multi-page tables. Test solutions against your actual complex tables.
- Cell-level confidence scores are the key differentiator. They let you review uncertain cells instead of entire tables.
- Bounding box visualization enables auditability. Click a value, see where it came from in the source document.
- Test with your hard cases. Simple gridlined tables work everywhere. Your borderless, multi-page, merged-cell tables are the real test.
Tables often contain the data that matters. The extraction solution you choose should be able to access it all, which is why we built DocuPipe.
Recommended Articles
Related Documents